Multiple Choice
Identify the
choice that best completes the statement or answers the question.
|
|
|
1.
|
Evaluate 
|
|
|
2.
|
A submarine descends at an average rate of 6.5 m/min. Express the depth below
the surface after 4.4 min as a rational number.
a. | -10.9 m | c. | -28.6
m | b. | 10.9 m | d. | +28.6 m |
|
|
|
3.
|
Which fraction has a square root between 3 and 4?
|
|
|
4.
|
The lengths of the two legs of a right triangle are 6.3 cm and 3.2 cm. Determine
the length of the hypotenuse, to the nearest tenth of a centimetre.
a. | 49.9 cm | c. | 5.4 cm | b. | 3.1 cm | d. | 7.1 cm |
|
|
|
5.
|
Ethan is building a fence around his square garden. The garden has an area of
54.99 m2. It costs $98.25 to build each metre of fencing. How much will Ethan spend, to
the nearest whole dollar?
a. | $2873 | c. | $729 | b. | $2916 | d. | $5403 |
|
|
|
6.
|
What is  ?
|
|
|
7.
|
What is 25 ¸  ?
|
|
|
8.
|
A pencil has a diameter of 9 mm. A scale diagram of the pencil has a diameter of
2.7 cm. Determine the scale factor of the diagram.
a. |  | c. | 30 | b. | 3 | d. | 0.3 |
|
|
|
9.
|
Advertising posters often show smaller images of large objects (like a car) or
larger images of small objects (like a calculator). If an actual object has a length of 256 cm and
the image on the poster is 160 cm, what is the scale used to make the poster?
|
|
|
10.
|
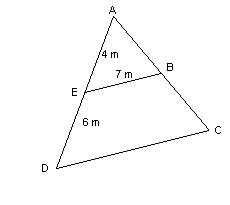
Determine the length of DC in this pair of similar triangles.  Diagram not drawn to
scale Diagram not drawn to
scalea. | 7 m | c. | 9 m | b. | 11.7 m | d. | 17.5 m |
|
|
|
11.
|
You and your family decide to travel to the United States. After crossing the
border, you notice speed limit signs saying the maximum speed is 60 miles/hour. What is this speed in
km/hour?
a. | 60.0 km/h | c. | 102.0 km/h | b. | 37.3 km/h | d. | 96.6 km/h |
|
|
|
12.
|
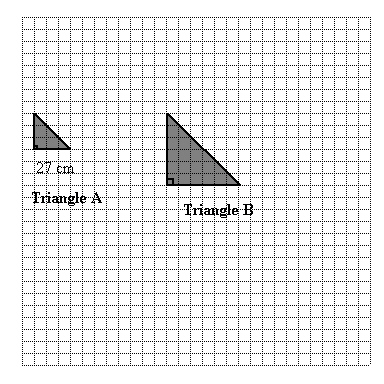
Triangles A and B are similar isosceles right triangles, related by a scale of
2:1. If each leg of Triangle A measures 27 cm, calculate the approximate length of the hypotenuse of
Triangle B.  a. | 27.0 cm | c. | 38.2 cm | b. | 54.0 cm | d. | 76.4 cm |
|
|
|
13.
|
A scale diagram of a field uses a scale of 2 mm : 1 m. Determine the actual
distance from A to C. 
|
|
|
14.
|
A digital picture on a computer screen is 6.8 mm wide. When the picture is
printed, the image is enlarged by a scale of 3.5:1. What is the width of the printed picture?
a. | 23.8 mm | c. | 10.3 mm | b. | 1.9 mm | d. | 3.50 mm |
|
|
|
15.
|
Write  as the product of two powers.
|
|
|
16.
|
Write  as a quotient of two powers.
|
|
|
17.
|
Write  as a single power.
|
|
|
18.
|
Write  as a single power.
|
|
|
19.
|
Which of the following numbers has the least value:  ,  ,  ,
 ,  ?
|
|
|
20.
|
Two cubes have edge lengths of 9 cm and 3 cm, respectively. What is the
difference in volume of the two cubes?
a. | 702 cm3 | c. | 756 cm3 | b. | 243 cm3 | d. | 27
cm3 |
|
|
|
21.
|
Evaluate  . a. | 1 048 576 | c. | 1024 | b. | 32 768 | d. | 2048 |
|
|
|
22.
|
In the term  , the letter d is best described as being a(n)
__________. a. | polynomial | c. | variable | b. | exponent | d. | coefficient |
|
|
|
23.
|
What is the degree of the term  ?
|
|
|
24.
|
What is the degree of the term  ?
|
|
|
25.
|
Expand and simplify 2w(6w2 + 3w – 4)
– 6w2.
a. | 12w3 + 12w2 – 8w | c. | 12w3 – 6w2 –
8w | b. | 12w3 – 8w | d. | 12w3 –
12w2 – 8w |
|
|
|
26.
|
What division statement is modelled by the algebra tiles? 
|
|
|
27.
|
An Internet service provider has projected the number of customers to be  ,
where m is the number of months after the business begins. What is the expanded form of this
expression?
|
|
|
28.
|
Determine the multiplication statement that is represented by the algebra tiles
below. 
|
|
|
Assume that this graph shows air pressure at different altitudes. Use the
graph to answer the following question(s).
|
|
|
29.
|
What is the approximate air pressure at an altitude of 5000 m?
a. | 45 kPa | c. | 35 kPa | b. | 25 kPa | d. | 40 kPa |
|
|
|
30.
|
If a balloonist measures the air pressure to be 75 kPa, at what approximate
altitude was the measurement taken?
a. | 1500 m | c. | 16500 m | b. | 9000 m | d. | 7500 m |
|
|
|
Use the graphs to answer the following question(s).
|
|
|
31.
|
Who walked at a faster rate?
a. | The graphs do not show who was faster. | c. | They walked at the same
rate. | b. | John | d. | Bill |
|
|
|
32.
|
Who walked at a faster rate?
a. | Bill | c. | John | b. | The graphs do not show who was
faster. | d. | They walked at the
same rate. |
|
|
|
33.
|
At what time has John walked 3 m further than Bill?
|
|
|
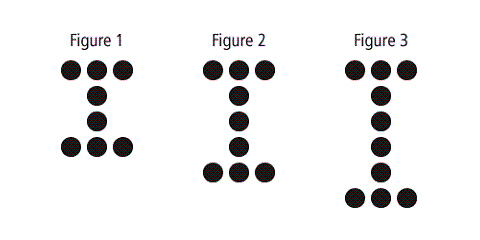
Use the figures to answer the following question(s).
|
|
|
34.
|
How many dots are in the thirteenth figure?
|
|
|
35.
|
What linear equation is represented by the following graph? 
|
|
|
Choose the best answer.
|
|
|
36.
|
Solve the following:  .
|
|
|
37.
|
Solve the following:  .
|
|
|
38.
|
Solve the following:  .
|
|
|
39.
|
Solve  .
|
|
|
40.
|
What is the value of x if  ? a. | x = –13 | c. | x = –0.08 | b. | x =
13 | d. | x =
0.08 |
|
|
|
41.
|
What is the solution to the equation  ? a. | t = –85 | c. | t = 0.49 | b. | t = 7 | d. | t =
–0.04 |
|
|
|
42.
|
Solve the following:  . a. | x = –25.2 | c. | x = 2.4 | b. | x = 5.0 | d. | x =
–12 |
|
|
|
43.
|
The average amount of daylight per day in Calgary is 14.6 h. The average amount
of daylight per day in Vancouver is 3.9 h more than half the number of hours in Calgary. What is the
average amount of daylight per day in Vancouver?
a. | 11.2 h | c. | 3.9 h | b. | 8.6 h | d. | 10.7 h |
|
|
|
44.
|
A school principal surveys only the boys in one class to determine if she should
make recess longer. This is an example of
a. | inappropriate use of language | c. | cultural
insensitivity | b. | bias | d. | poor
timing |
|
|
|
45.
|
A textile company would like to know how people feel about the new mill they are
about to open in a community. Which survey question is the most appropriate?
a. | Do you agree with the very narrow-minded few who are not in favour of the new
mill? | c. | Do you agree with everyone else that the new mill is a great
idea? | b. | Are you in favour of the new mill that will bring many jobs to the
area? | d. | Are you in favour of
having a textile mill in your community? |
|
|
|
46.
|
Martin is conducting a survey to determine if the school cafeteria should stop
selling soft drinks. From what population should he take his sample?
a. | people who work at a soft-drink factory | c. | adults who have no
kids | b. | people who eat lunch in the cafeteria | d. | people who are allergic to soft
drinks |
|
|
|
47.
|
Which of the following methods will give a simple random sample?
a. | Survey the students in your class who walked to school that day. | c. | Survey the students
who the teacher selects to answer questions. | b. | Survey the first 15 students who enter the
classroom. | d. | Survey the
students whose names you pick from a hat. |
|
|
|
48.
|
Which population would you use if you were asking: “Do the boys or the
girls in your school have different musical tastes?”
a. | the boys in your school | c. | the girls in your
grade | b. | the students in your school | d. | the students in your grade |
|
|
|
49.
|
Which population would you use if you were asking: “Are Canadian voters
supportive of the Prime Minister?”
a. | a sample from the voting-age population of Canada | c. | the entire population of
Canada | b. | all adults between 21 and 65 years | d. | all the people who voted in the last federal
election |
|
|
|
50.
|
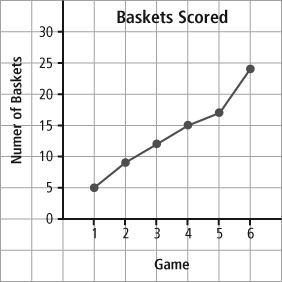
A coach is checking the statistics on a player and wants to know whether the
player is making progress over the season. Is the graph shown below the best graph to use?  a. | No, because you cannot easily compare the data between two games. | c. | Yes, because you
can see a positive trend in the data over time. | b. | Yes, because the data can be easily
counted. | d. | No, because you
cannot see the full season. |
|