Multiple Choice
Identify the
choice that best completes the statement or answers the question.
|
|
|
1.
|
In the equation  , determine the value of P when n = 9.
|
|
|
2.
|
In a table of values for a pattern, P = 12 when n = 3. Determine
the equation that might represent the pattern.
|
|
|
3.
|
Determine an equation that relates the number of circles, C, to the
figure number, n. 
|
|
|
4.
|
Which graphs represent a linear relation? 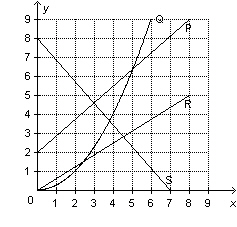 a. | P only | b. | P, R, and S | c. | P and S | d. | P and
R |
|
|
|
5.
|
Which tables of values represent a linear relation? i) ii) iii) iv) a. | ii, iii, and iv | b. | ii and iii | c. | All of these | d. | i and
iv |
|
|
|
6.
|
Complete the table of values.  
|
|
|
7.
|
Sean cycles at an average speed of 5 m/s.
He travels a distance, d
metres, in t seconds.
Write an equation that relates d and t.
|
|
|
8.
|
Which equation describes the graph? 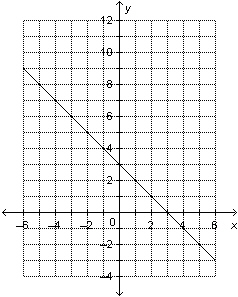
|
|
|
9.
|
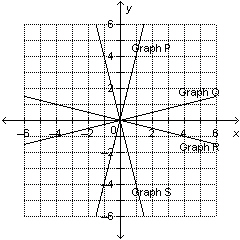
Which graph on this grid has the equation  ?  a. | Graph S | b. | Graph R | c. | Graph Q | d. | Graph
P |
|
|
|
10.
|
Which equation describes the graph below? 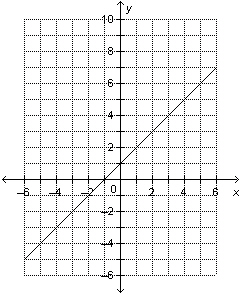
|
Short Answer
|
|
|
11.
|
This is a partially completed table of values for
a linear relation.
a) Determine the missing values of
y.
b) Write an equation that represents the
linear relation.
|
|
|
12.
|
a) Graph the
straight line that passes through the points (0, 10), (3, 7), and (10, 0).  b) Write an equation to describe the line.
|
|
|
13.
|
Match each equation with a graph on the grid below.
|
|
|
14.
|
Which of these equations does not have its graph on the grid
below? 
|
|
|
15.
|
This graph shows the gas consumption rate of a car. a) Estimate the volume of gas required to
travel 630 km.
b) Estimate the distance the car can travel on 60 L
of gas.

|
Problem
|
|
|
16.
|
The pattern in the table continues. a)
Describe the pattern that relates P to n. b) Write an equation that relates P
to n.
|
|
|
17.
|
Amir went to a pie-tasting festival. The festival charges an admission fee of
$3.00, plus $2.00 for every slice of pie you eat. a) Write an equation that relates the total
cost, C dollars, to the number of slices of pie you eat,
r. b) Graph the equation. Which variable will you plot on the
horizontal axis? Explain your reasoning.  c) Will
you join the points on the graph? Explain. d) If Amir spent $17.00,
how many slices of pie did he eat?
|
|
|
18.
|
The sum of two rational numbers, p and q, is 1.5. a) Make a table to show 5 possible pairs of
numbers that satisfy this relation.
Include p = -1.5 and q = -1.5 in your
table.
b)
Graph the data. Describe your graph. 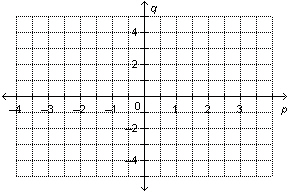 c)
Write an equation for the relation.
|
|
|
19.
|
The lines on the grid below intersect to form rectangle PQRS. The equations
of the lines are:  ; ;  ;  ; and  What is the
equation of the line on which each side of the rectangle lies? a) PQ
b) QR c) RS d) PS 
|
|
|
20.
|
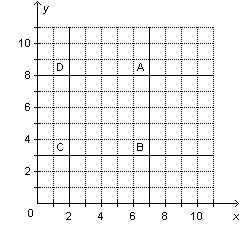
The lines on the grid below intersect to form square ABCD. The equations of the
lines are: What is the equation of the line on which each side of the square lies? a) AB b) BC c)
CD d) AD
|